Leadership Compensation
Leadership compensation reflects an organization’s priorities and values. This page examines executive pay within the district and compares it to national norms, classroom wages, and district growth trends. The goal is not rhetoric, but transparency—providing clear, data-based context so parents, educators, and taxpayers can understand how leadership compensation aligns with student outcomes, fiscal responsibility, and the core mission of public education.
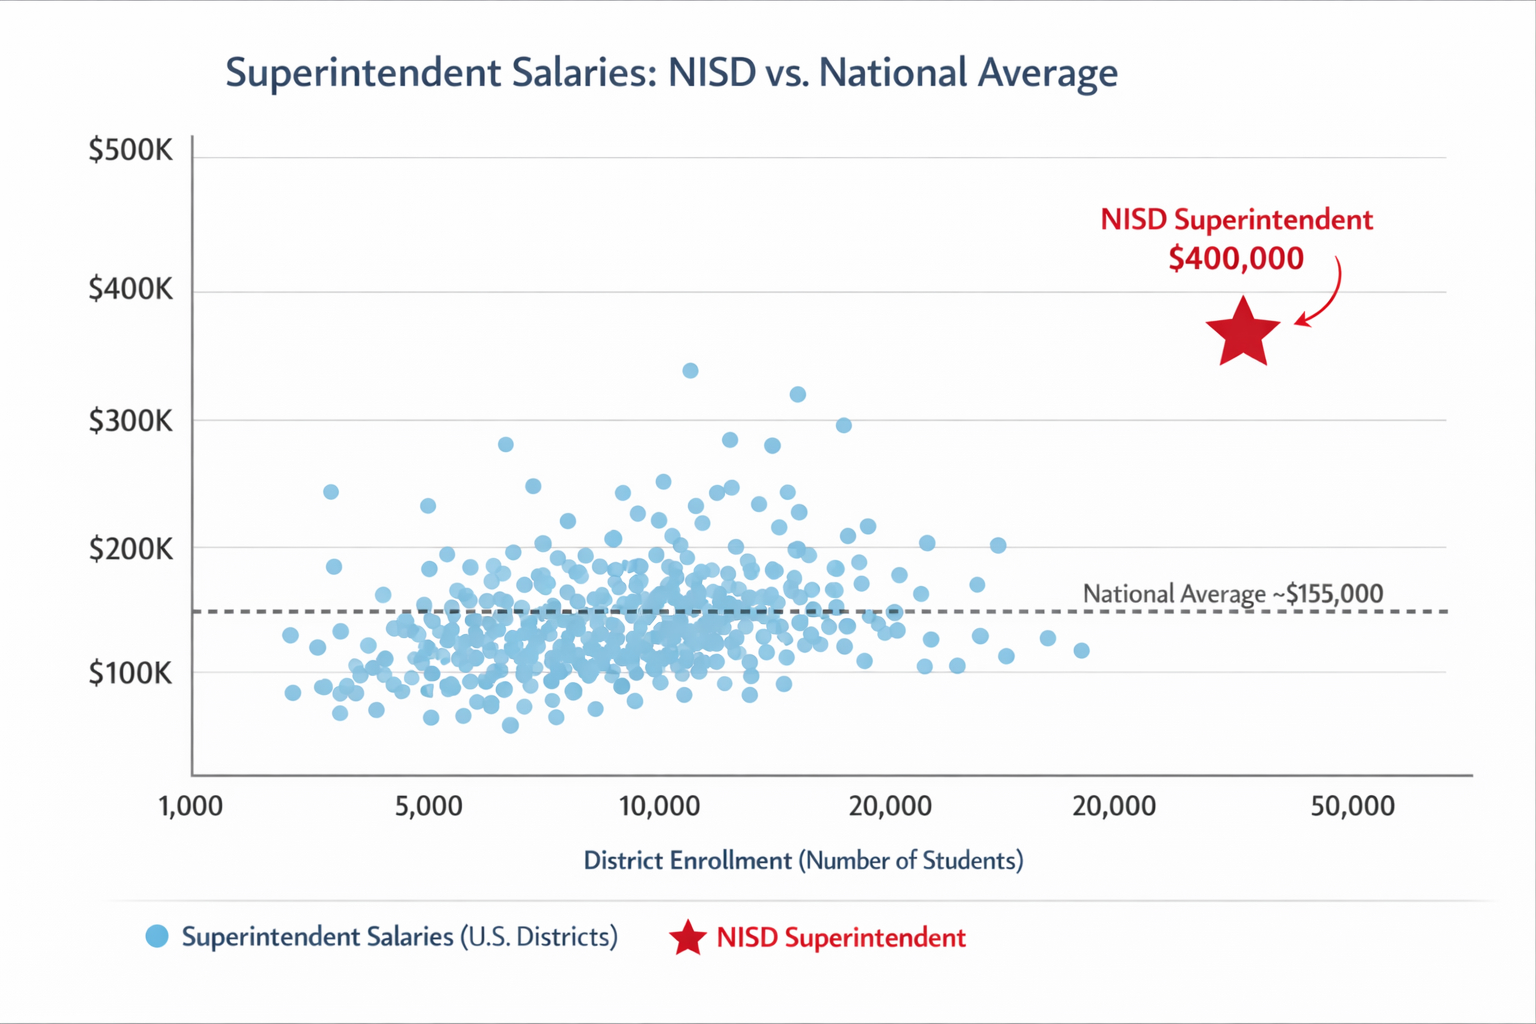
Executive Pay vs. Classroom Pay
Our analysis of publicly available compensation data shows a severe imbalance between executive compensation and classroom pay within NISD.
The Superintendent’s compensation is approximately $400,000 per year
The average teacher salary is approximately $65,000 per year
This represents a pay ratio of roughly 6:1, placing the superintendent’s compensation near the 99th percentile nationally among public school districts. This level of executive pay is extraordinarily high and not typical for U.S. public school systems, particularly when compared against teacher wages.
Public education should prioritize the classroom—not executive compensation at the extreme upper edge of national norms.
Administrative Growth vs. Student Growth
Over the last 15 years, NISD has experienced significant enrollment growth—but administrative staffing has grown at a far faster rate.
Student enrollment has approximately doubled
Administrative staffing has nearly tripled
This growth pattern is not typical and runs counter to how large school districts normally scale.
Why this matters:
Smaller districts often have higher administrator-to-student ratios because fixed roles cannot be shared.
Larger districts should gain efficiency, resulting in more students per administrator, not fewer.
At NISD, the opposite has occurred:
As enrollment increased, administrative headcount and administrative payroll increased disproportionately
The student-to-administrator ratio has declined, signaling administrative bloat rather than operational efficiency
Examples of Administrative Compensation
Current staffing and salary data shows significant spending concentration in non-instructional roles, including:
4 Human Resources Directors earning approximately $125,000 each
22 Business Services professionals earning approximately $95,000 each
52 Educational Diagnosticians earning approximately $80,000 each
25 IT professionals earning approximately $90,000 each
1 Business Manager earning approximately $200,000
These roles may serve important functions—but the scale and cost raise serious questions about priorities, efficiency, and oversight.
Our Position: Spend on Teachers, Not Bureaucracy
We believe NISD should re-prioritize funding toward the classroom, where it has the greatest impact on student outcomes.
Our proposal:
Increase the average base pay of every K–12 teacher to $100,000 per year
Financial impact:
Current estimated teacher payroll: $136 million
Proposed teacher payroll: $149 million
Net increase: $13 million
This is a manageable increase within the district’s overall budget and could be achieved through:
Administrative consolidation
Slower growth in central office staffing
Restoring scale efficiencies expected of a large district
Strong teacher pay improves:
Recruitment
Retention
Classroom stability
Student outcomes
Supporting Local Texans First
NISD currently employs 86 staff members who are on:
Immigrant visas
Work permits
Permanent resident (Green Card) status
While all employees deserve respect, we believe local Texans should be prioritized whenever possible.
Our position is simple:
There are at least 86 qualified Texans who can fill these roles.
Public school districts exist to serve local communities—and that includes local workers and local families.
Our Core Principle
NISD is not short on money.
It is short on discipline, prioritization, and accountability.
We advocate for:
Teachers over administrators
Classrooms over bureaucracy
Local Texans over imported labor
Efficiency over excess
Public education should serve students—not sustain an ever-expanding administrative apparatus.
Why it matters
Public education succeeds or fails based on how well it prioritizes the classroom. When executive compensation and administrative staffing grow far faster than student enrollment or teacher pay, it diverts resources away from instruction—the single most important driver of student outcomes. Large districts should benefit from economies of scale, with more students served per administrator over time, not fewer. Persistent growth in bureaucracy, combined with extreme outlier executive pay, undermines efficiency, strains public trust, and limits the district’s ability to meaningfully invest in teachers, retention, and classroom stability.
Sources
National Superintendent Salary Benchmarks
American Association of School Administrators (AASA) – Superintendent Salary & Benefits Study
National survey reporting median and average superintendent compensation across U.S. public school districts.
https://www.aasa.org/docs/default-source/resources/reports/2022-23-superintendent-salary-benefits-study-abridged-version.pdf
Education Week – Superintendent Salaries and National Trends
Analysis of superintendent pay by district size, including national average salary figures (approximately $155,000–$160,000).
https://www.edweek.org/leadership/superintendents-salaries-and-their-plans-for-next-year-in-charts/2023/03
The School Leader – National Superintendent Salary Survey
Summary of AASA data showing median superintendent base pay and trends over time.
https://www.theschoolleader.org/news/younger-superintendents-rise-amid-stagnant-real-wages-national-survey-finds
District Size, Administrative Staffing, and Efficiency
DPEA/AFL-CIO Educational Administrators Overview — Student-to-Administrator Ratio
Shows that national average student-to-administrator ratio was approximately 252:1 in K-12 schools, indicating how many students there are, on average, per administrator.
https://www.dpeaflcio.org/factsheets/school-administrators-an-occupational-overview
PowerSchool Resource Page on Staff Capacity & Ratios
Example illustrating how administrator staffing changes affect student-to-administrator ratios (e.g., more administrators means a smaller ratio).
https://www.powerschool.com/k-12-resource-planning/staff-capacity-and-costs-over-time
National Center for Education Statistics (NCES) – Local Education Agency Staffing Data
Federal dataset providing counts of administrators, teachers, and students by district size, used to analyze staffing ratios as districts grow.
https://nces.ed.gov/programs/digest/d23/tables/dt23_213.10.asp
NCES – Characteristics of Large School Districts
Shows how larger districts typically achieve scale efficiencies and staffing normalization as enrollment increases.
https://nces.ed.gov/programs/coe/indicator/cgb/public-school-district-enrollment
Education Commission of the States – School District Governance and Administration
Discusses administrative structures, staffing ratios, and operational efficiency as district enrollment expands.
https://www.ecs.org/school-district-governance/
NISD Staffing Spending for 2024