Results & TEA Ratings
This page analyzes Northwest ISD’s academic outcomes using TEA data to assess whether results are keeping pace with enrollment growth and increased spending.
Concerning Performance Trends (Northwest ISD & Northwest High School)
This section highlights the most concerning academic trends identified in official Texas Education Agency (TEA) assessment data. The analysis is intentionally limited to Northwest ISD and NISD’s flagship high school - Northwest High School. Peer campuses are referenced only where TEA’s reports include direct side-by-side comparisons, to provide context.
Districtwide STAAR Math: backsliding after 2023 gains
Northwest ISD’s districtwide STAAR math performance in grades 5 and 7 shows a clear pattern of regression after improvement in 2023.
In Grade 7 Math, the share of students who Did Not Meet Grade Level increased from 34% (Spring 2023) to 42% (Spring 2025), while the share reaching Meets Grade Level or higher declined.
In Grade 5 Math, the percentage of students Did Not Meet rose from 18% (Spring 2023) to 25% (Spring 2025), while higher performance levels softened.
These grades are critical pipeline years for later Algebra readiness. Rising “Did Not Meet” rates at these stages increase the likelihood that students enter high school underprepared for core math coursework.
Northwest High School Algebra I: extreme underperformance relative to peers
Northwest High School’s Algebra I End-of-Course (EOC) results are the most concerning trend in the available data.
In Fall 2025, approximately 66% of students Did Not Meet Grade Level, while only ~1% reached Meets Grade Level or higher, with 0% at Masters.
Earlier results show that the share of students reaching “Meets” or above has collapsed over time, falling sharply from earlier years.
When compared to peer high schools included in the same TEA report, Northwest High School’s Algebra I outcomes are dramatically lower, particularly in the percentage of students reaching “Meets” and “Masters.” This places Northwest High School in a significantly weaker performance tier for a core graduation and college-readiness course.
Because Algebra I is a gatekeeper for Geometry, Algebra II, and most STEM pathways, persistent underperformance at this level has long-term consequences for student opportunity and postsecondary readiness.
Northwest High School English I: persistently high failure rates
Northwest High School’s English I EOC results show a similar pattern of concern:
Across multiple years, roughly 70% or more of students Did Not Meet Grade Level.
The share of students reaching Meets Grade Level or higher remains in the single digits, with Masters consistently around 1%.
While there has been minor fluctuation year to year, the overall pattern is one of persistently weak performance in a required core subject tied directly to graduation and college readiness. Compared with peer high schools included in the same TEA report, Northwest High School’s English I outcomes are substantially worse, particularly in higher achievement levels.
Why these trends matter
Taken together, these patterns suggest system strain rather than isolated issues:
Districtwide math outcomes show worsening results after temporary improvement, not steady progress.
Northwest High School’s Algebra I and English I results indicate serious readiness gaps in foundational high-school coursework.
Peer comparisons confirm that these outcomes are not simply regional or statewide norms, but represent underperformance relative to similar campuses.
In a fast-growing district making long-term financial commitments, these trends raise important questions about instructional capacity, planning, and whether academic results are keeping pace with expansion and spending.
Data sources
Texas Education Agency – STAAR Aggregate Data (district and campus level)
Texas Education Agency – Research Portal exports (Northwest ISD; Northwest High School)
(All figures cited above are drawn directly from TEA-published assessment data.)

Attendance & Chronic Absenteeism
Key findings from TEA attendance/graduation/dropout reporting:
Chronic absenteeism in Northwest ISD increased sharply from 3.3% (2019–20) to 16.4% (2021–22) and remains ~12% in the most recent years—still far above pre-pandemic levels.
Attendance stabilized around 94.9%, well below 99.1% in 2019–20.
Absenteeism is highest in higher-need groups (e.g., economically disadvantaged and special education), which increases the risk of widening gaps.
Annual dropout is low, but the longitudinal dropout risk is meaningfully higher within specific subgroups (notably Special Education in Class of 2023).
Chronic absenteeism spiked after 2020 and has not returned to pre-pandemic levels
Northwest ISD’s chronic absenteeism shows the clearest negative trend across years. In 2019–20, the district’s chronic absenteeism rate was 3.3%, but by 2020–21 it rose to 7.9% and then jumped again to 16.4% in 2021–22.
While the district improved to 12.3% in 2022–23 and 12.1% in 2023–24, chronic absenteeism remains roughly 3–4x higher than 2019–20.
Why this matters: chronic absenteeism is one of the most reliable early warning indicators of academic decline. When more students miss substantial instructional time, districts typically see weaker STAAR performance, more course failure, and greater remediation needs—especially in math and reading.
Attendance has improved since 2021–22, but remains well below 2019–20 levels
District attendance fell from 99.1% (2019–20) to 96.4% (2020–21), then to 94.1% (2021–22). It has since stabilized at 94.9% in 2022–23 and 2023–24.
Chronic absenteeism remains materially higher for economically disadvantaged and special education students
Across the years shown, the highest chronic absenteeism rates cluster in student groups that already face academic risk.
For example:
In 2021–22, chronic absenteeism was 21.6% for economically disadvantaged students and 25.4% for special education, compared to 16.4% overall.
In 2023–24, the district improved overall to 12.1%, but economically disadvantaged students remained at 16.2%and special education students at 16.2%.
Why this matters: if absenteeism is concentrated in higher-need groups, it tends to widen achievement gaps and increases the number of students who fall off-track for college/career readiness even when overall district averages look “okay.”
Annual dropout rates are generally low, but “longitudinal dropout” shows risk within specific student groups
Northwest ISD’s annual dropout rates are relatively low and have generally improved in recent years (e.g., Grades 9–12 annual dropout rate fell to 0.5% in 2023–24).
However, the 4-year longitudinal dropout rate (tracking a class over time) shows that dropout risk can be much higher in specific student groups.
For the Class of 2023, the report shows Special Education with a 10.8% “Dropped Out” rate in the 4-year longitudinal table.
For the Class of 2024, Special Education dropout improved to 4.7%, but it remains a meaningful risk signal compared to the overall district.
Graduation remains strong overall, but it doesn’t offset attendance risk
Northwest ISD’s 4-year longitudinal graduation rate is strong (e.g., 96.0% for the Class of 2024). However, graduation rates can remain high even while early warning indicators (like chronic absenteeism) deteriorate. Chronic absenteeism is the metric most likely to show problems before they appear in graduation averages.
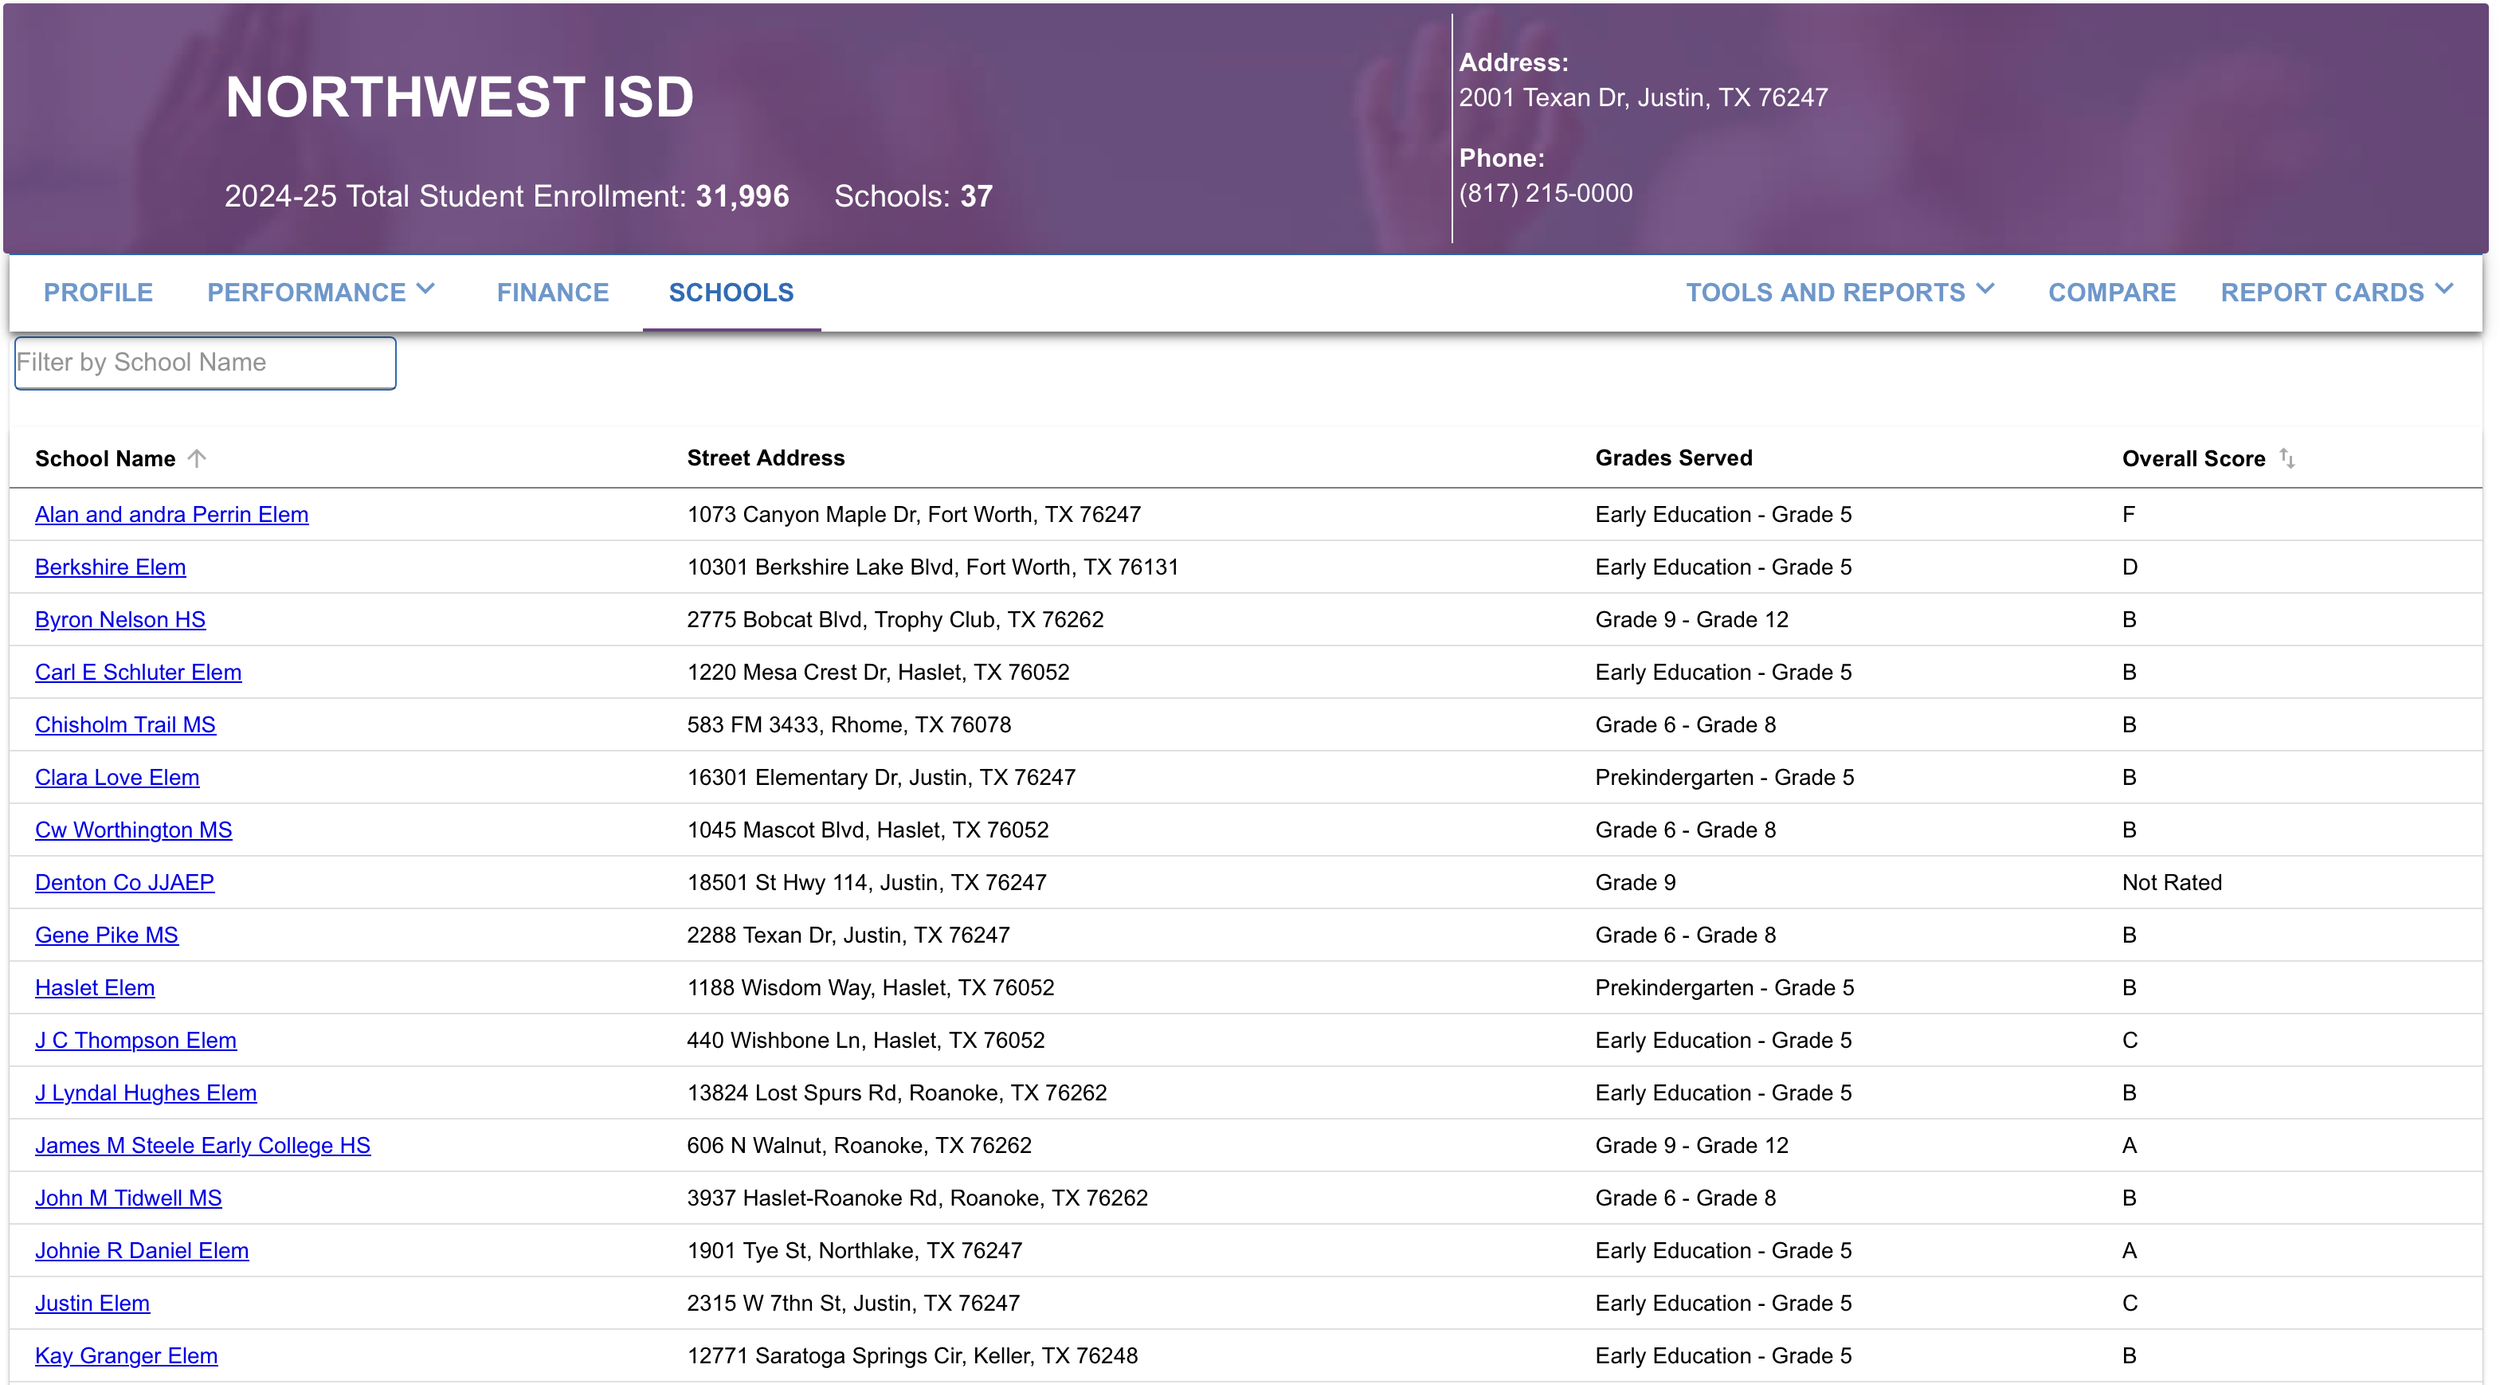
TEA Ratings - 2.76 NISD GPA
What the campus GPA shows
When TEA campus letter grades are converted to a standard 4.0 GPA scale, Northwest ISD’s campuses average 2.76, roughly a B- / C+. While a majority of campuses are rated A or B, nearly one-third of rated campuses are C, D, or F, including one campus rated F and two rated D.
This matters because district-level averages can mask underperformance at individual campuses. For families, students, and taxpayers, outcomes are experienced at the campus level, not the district average. A mixed grade distribution suggests uneven performance across the system and highlights the need for targeted improvement, transparency, and accountability—especially as the district undertakes large, long-term financial commitments.
Methodology note
This “Campus GPA” is a summary tool derived from official TEA letter grades using a standard academic scale (A=4, B=3, C=2, D=1, F=0). Campuses labeled “Not Rated” by TEA are excluded from the GPA calculation. This is not an official TEA metric, but a way to summarize campus-level results in a familiar format.
https://txschools.gov/?view=district&id=061911&tab=schools&lng=en
Why it matters
Taken together, Northwest ISD’s academic indicators point to systemic performance risk, not isolated issues. STAAR testing shows declining or persistently weak outcomes in key gateway subjects, particularly math and English, with some campuses—most notably Northwest High School—showing extremely low percentages of students reaching “Meets Grade Level” in Algebra I and English I. These subjects are foundational for graduation, college readiness, and access to advanced coursework.
At the same time, chronic absenteeism remains roughly four times higher than pre-pandemic levels, even after recent improvements. Elevated absenteeism is one of the strongest predictors of lower academic achievement, course failure, and widening gaps—especially when concentrated among higher-need student groups. Attendance problems tend to surface before declines appear in graduation rates, making them an early warning signal rather than a lagging one.
Campus-level accountability results reinforce this concern. When TEA letter grades are summarized across campuses, Northwest ISD’s campus GPA is 2.76 (B-/C+), with nearly one-third of rated campuses receiving a C, D, or F, including one campus rated F and two rated D. While district-level averages can appear acceptable, students experience outcomes at the campus level, and uneven performance across campuses indicates inconsistent instructional results within the system.
These trends matter because they are occurring alongside major long-term financial commitments. When academic outcomes, attendance, and campus ratings show signs of strain, it raises legitimate questions about whether growth, staffing, and instructional supports are keeping pace with the scale of expansion and spending. Clear accountability, transparent reporting, and targeted intervention become more—not less—important when the district is asking taxpayers and families to shoulder obligations that will last for decades.